Feeling Thermometers 2020 ANES (2022)
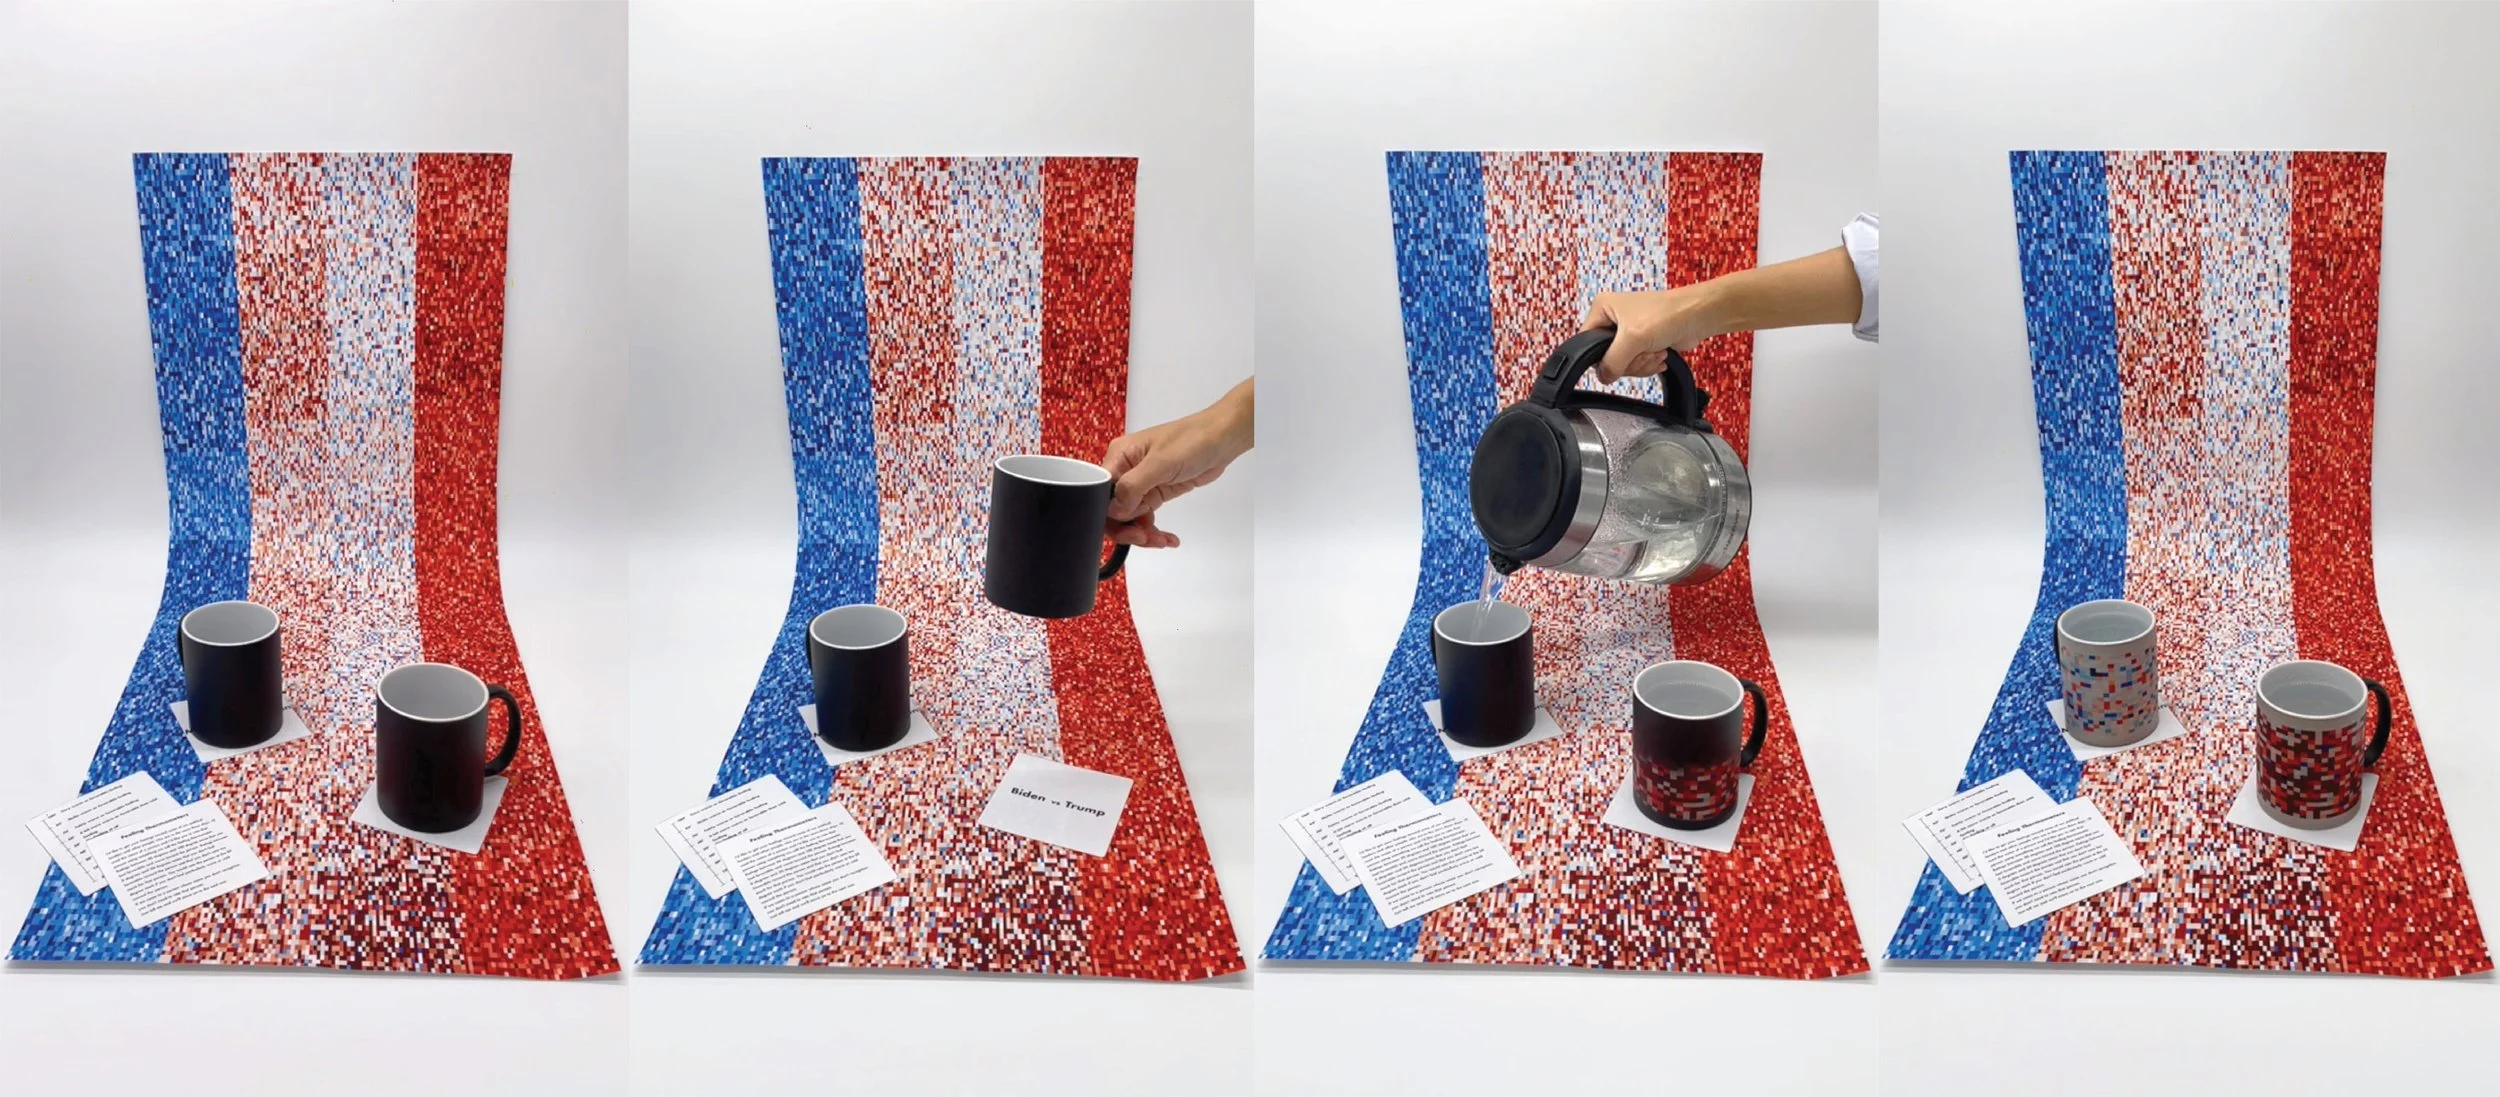
One of my data-driven works, Feeling Thermometer from 1984 to 2020 (ANES), examines a fundamental question: “How do we feel about each other?” This piece captures the emotional landscape of partisan relationships over decades, visualizing how Americans have perceived the Democratic and Republican parties from 1984 to 2020. Though still evolving in its direction, this project holds deep meaning for me as it reflects the societal temperature of our shared experience.
To create this work, I employ data from the ANES (American National Election Studies). I begin by randomly sampling 1,000,000 respondents (20%) using a Bernoulli Trial, then map them onto a 1,000x1,000 grid, each position randomly assigned without replacement. Each individual is represented by a color on a spectrum ranging from very cold to very hot, symbolizing their feelings toward the Democratic and Republican parties. This process generates two heatmaps, one for each party, illustrating the emotional contours of political identity.
As 2024 approaches, I find myself revisiting this project in anticipation of new data. It is a reflection of the evolving dynamics of our society—how we perceive, understand, and feel about one another in a landscape shaped by decades of division and connection.


